
How PRECOG analyses periodic motion waveforms
Machines such as railway point machines move in cycles. PRECOG analyses every moment of the measured curve, so faults show up even where a single threshold would not see them.
Telemetry data process
One additional step for periodic motion
It helps to read this article once you are familiar with how PRECOG is used for continuous-operation machines (see data evaluation). Only one additional step is needed when the same approach is used for periodic motion: PRECOG has to be calculated for each moment in time along the curve.
For this, select a single moment and gather the values of that moment from every curve, as shown in the figure. When the calculation is done for every moment, it gives a clear picture of which segments of the curve contain anomalies.
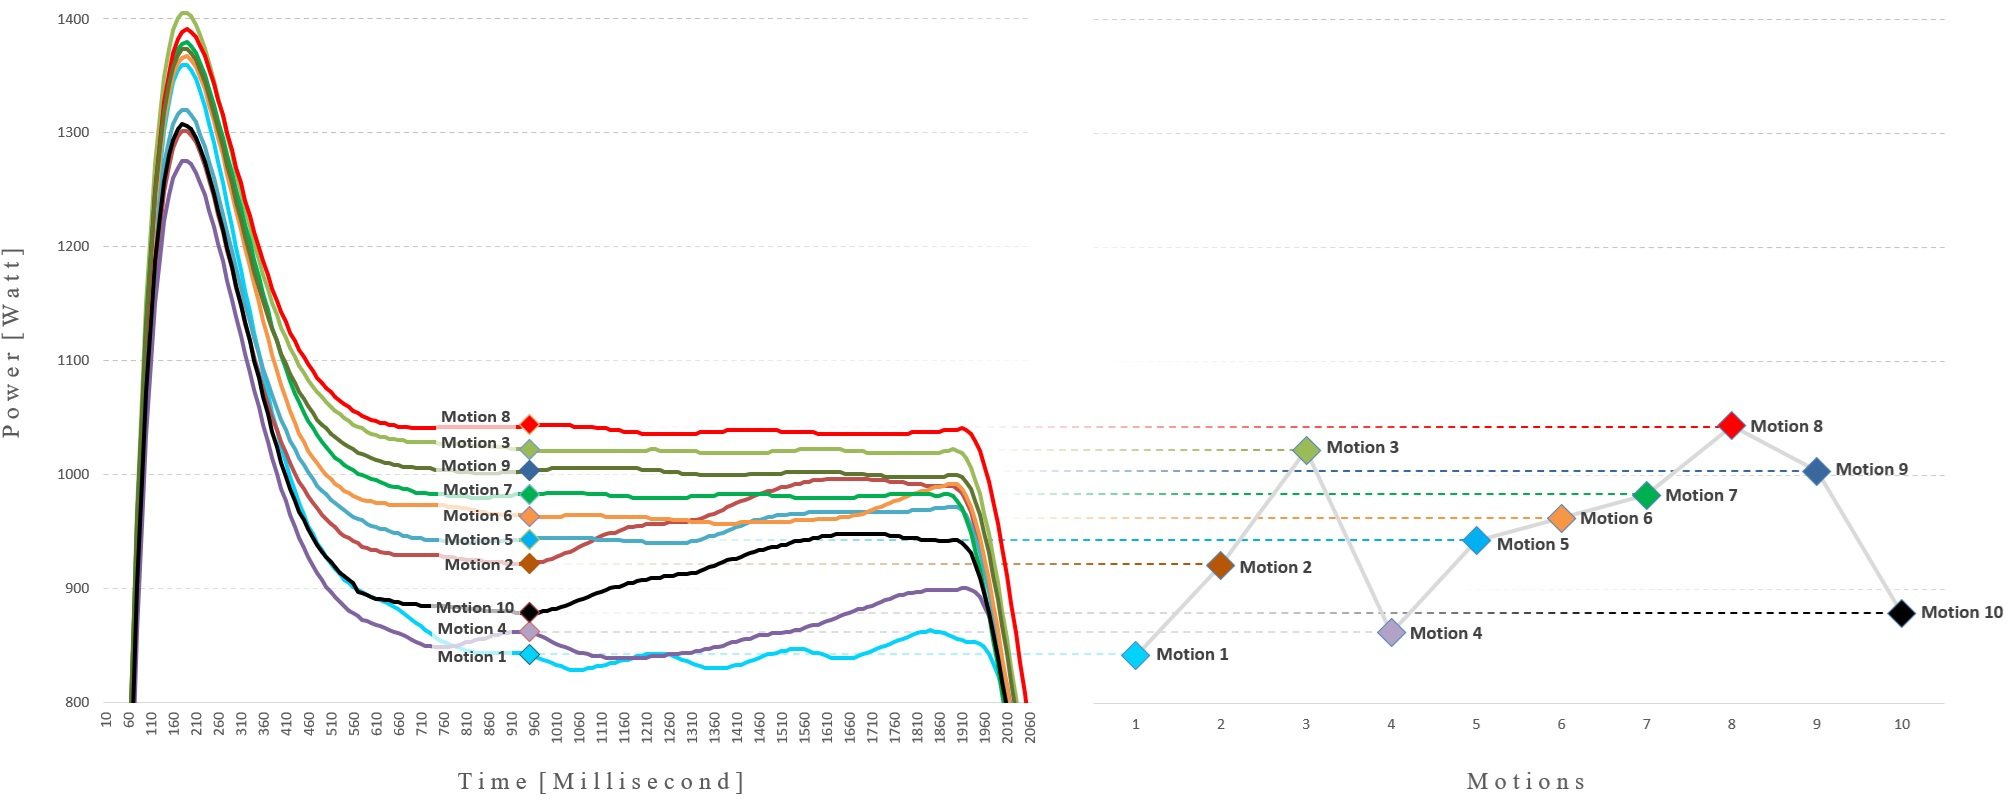
Each moment of a periodic curve is evaluated, so one motion can show several anomalies at once. Counting them gives a good picture of the general health of the machine.
Target and tolerance
Setting the first target values
In our experience it is worth setting the target value for each moment to the maximum value recorded during proper operation under normal operating conditions, and basing the tolerance on the standard deviation of the data. The specifications of the manufacturer, such as the maximum power consumption, must be taken into account as well. After that, test cases can refine the target and tolerance values until the wanted result is reached.
Measurement
The measuring instrument matters
The accuracy, the sensitivity and the sampling frequency of the measuring instrument can strongly influence which fault types can be detected in a device. Review the technical specification of the instrument carefully and test it on a sample device before a wide roll-out.
Recipes
Dividing the curve into sections with recipes
For a more refined analysis, and to tell the possible faults apart, the curve is divided into smaller sections based on the test results. The analysis of the test data shows which time periods have to be monitored.
A recipe can then be written for quick and easy evaluation of the data that PRECOG provides. The recipe can be fine-tuned from experience and, in most cases, can be applied right away to many units of the same type of equipment. Each section is evaluated against the recipe to identify the fault.
Example 1
Stress due to a deformed switch blade
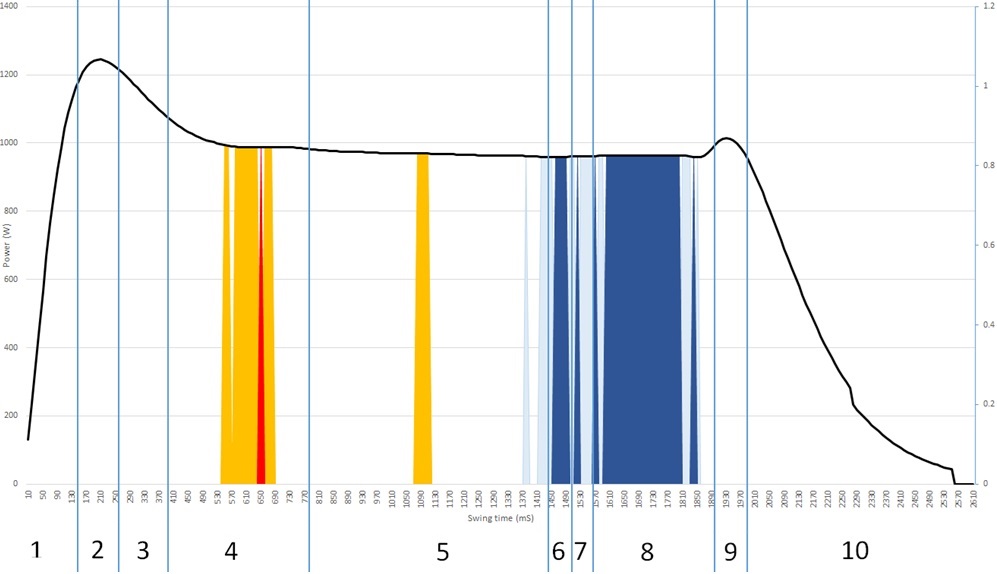
The recipe
| Section | Relevant | Percentage | Number of anomalies / range of motion |
|---|---|---|---|
| 1 to 3 | Yes | above 90% | Low / inside |
| 4 | Yes | above 30% | Multiple / inside |
| 5 | Yes | above 80% | Few / inside |
| 6 | Yes | above 30% | Irrelevant / below |
| 7 | Yes | above 15% | Irrelevant / below |
| 8 | Yes | above 60% | Irrelevant / below |
| 9 | Yes | above 50% | Low / inside |
| 10 | Yes | above 90% | Low / inside |
Example 2
Abnormal operation due to extraneous material
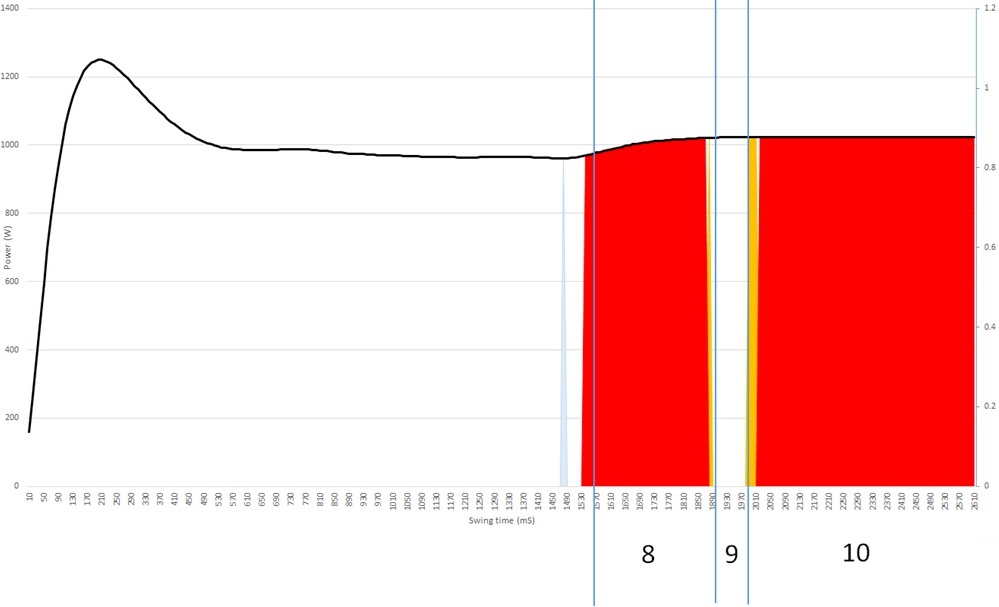
PRECOG also finds the faults that threshold methods find, so one approach covers every fault that the measured data can show.
The recipe
| Section | Relevant | Percentage | Number of anomalies / range of motion |
|---|---|---|---|
| 1 to 7 | No | ||
| 8 | Yes | above 70% | Multiple / above |
| 9 | No | ||
| 10 | Yes | above 85% | Multiple / above |
The same recipe approach works for other periodic machines, for example the railway turnouts in the railway case study.
Do you have a machine with periodic motion?